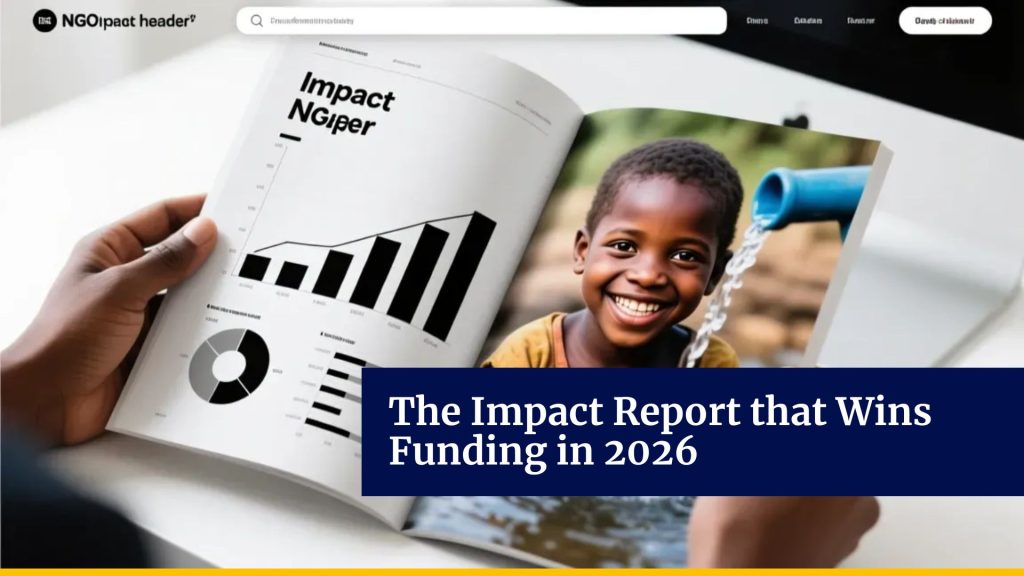
Why Your NGO’s Impact Report Is Costing You Donors (And How to Fix It)
Sarah Martinez had been staring at her laptop screen for twenty minutes, scrolling through her NGO’s latest impact report. As the donor relations director for a clean water nonprofit, she’d poured weeks into crafting the perfect document—charts showing 47,000 people served, graphs depicting a 73% reduction in waterborne diseases, maps dotted with 156 new wells across three countries.
It was comprehensive. It was data-rich. It was exactly what donors wanted to see.
Or so she thought.
Three months after sending the report to their donor base, Sarah sat in a tense board meeting reviewing the numbers. Donor retention had dropped by 18%. Repeat contributions were down. And most troubling of all, their most generous supporters—the ones who’d given faithfully for years—were going quiet.
“What happened?” the executive director asked, genuine confusion in his voice. “We showed them everything. Every metric, every outcome, every proof point that their money made a difference.”
Sarah didn’t have an answer that day. But a conversation with a lapsed donor two weeks later changed everything she thought she knew about impact reporting.
The Donor Who Disappeared
When Sarah finally reached Lisa Chen, a donor who’d contributed $500 annually for five years before suddenly stopping, she expected to hear about financial constraints or changing priorities. Instead, Lisa said something that made Sarah’s stomach drop.
“I read your report,” Lisa said quietly. “All 32 pages of it. And when I finished, I honestly couldn’t remember a single person you’d helped. Just numbers. Lots and lots of numbers.”
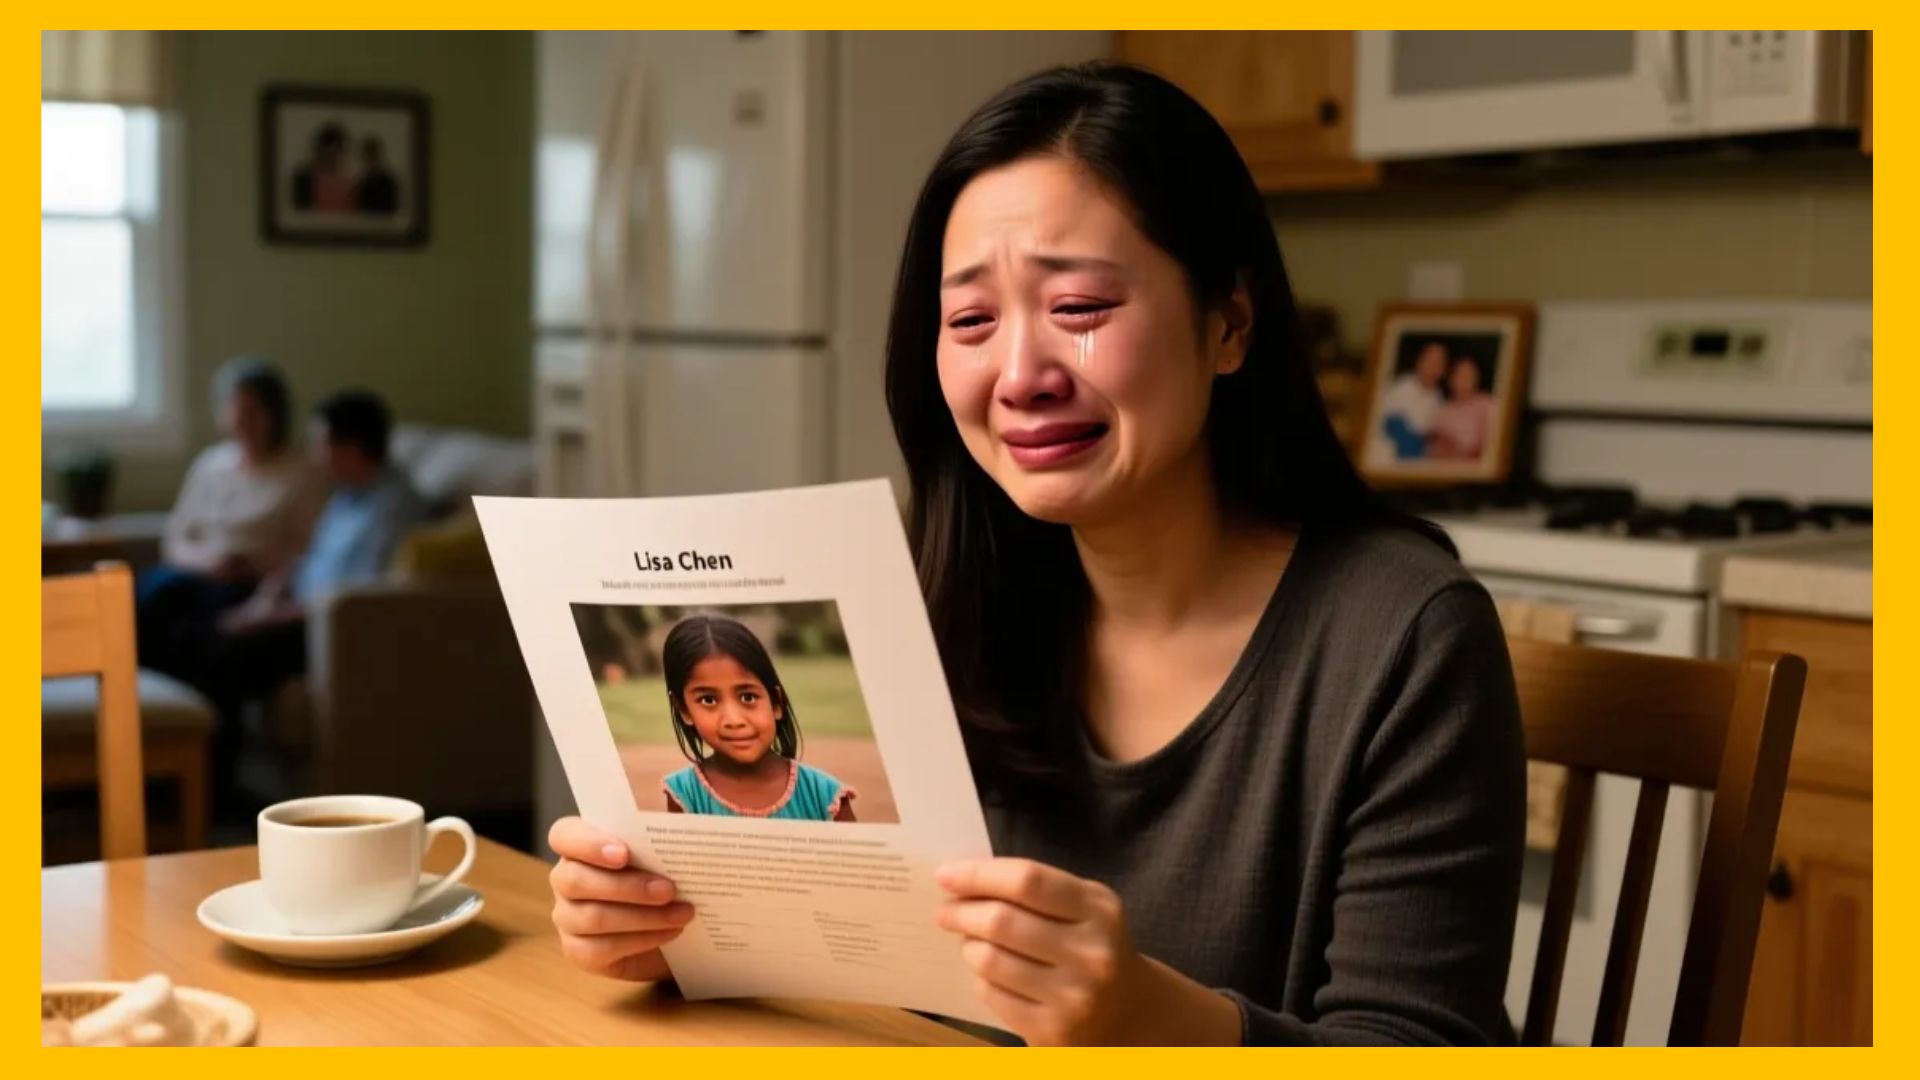
Lisa explained that she’d started donating after hearing a story at a fundraising event—about a young girl named Amara who’d walked six miles every day to fetch water, missing school, risking her safety. That story had moved Lisa to tears and inspired her first donation.
“I wanted to know what happened to girls like Amara,” Lisa continued. “But your report just told me about ‘beneficiaries’ and ‘service populations.’ I couldn’t see their faces anymore. I couldn’t feel why it mattered.”
That conversation sent Sarah down a research rabbit hole that would transform how her organization communicated impact—and ultimately recover those lost donors and attract many more.
The Science Behind the Story
Sarah discovered something fundraising experts have known for years but nonprofits consistently ignore: human brains remember narratives far more effectively than they recall statistical information.
The data was striking. Organizations implementing storytelling-focused strategies experienced donor retention increases of up to 67%. Meanwhile, the average donor retention rate across the nonprofit sector had fallen to just 42.9%, with only 19.4% of first-time donors giving again.
The problem wasn’t that statistics were bad—it was that organizations like Sarah’s were leading with them, drowning the human element in a sea of percentages and pie charts.
Tyler Riewer from charity: water, one of the most successful fundraising organizations globally, explained the issue simply: typical nonprofit communications rely heavily on statistics, but facts aren’t as memorable as individual stories.
Consider this: charity: water could tell you that 663 million people lack access to safe drinking water. That’s a staggering, important number. But they found more impact by sharing the story of Aissa Marou, a woman in Niger who fell into a cement well with her baby strapped to her back while trying to collect water. One story, one person, one moment of crisis that donors could visualize and feel.
Why Your Brain Chooses Story Over Statistics
The neuroscience is clear: when you hear a statistic, only two regions of your brain activate—those responsible for language processing. But when you hear a story? Multiple parts of the brain light up, improving message retention and creating deeper emotional connections.
This explains why Sarah’s meticulously crafted report failed while a single story about Amara had inspired Lisa’s five-year giving streak. The statistics informed Lisa intellectually, but the story had connected with her emotionally—and emotion drives action.
Research consistently demonstrates that individuals are significantly more likely to donate when presented with the story of one identifiable person rather than broad statistical data. It’s not that people don’t care about the 47,000 served—it’s that they need to see one person’s transformation to understand what 47,000 transformations means.
The Charity: Water Blueprint
After Lisa’s feedback, Sarah studied organizations that had mastered the art of story-driven impact reporting. Charity: water stood out as the gold standard, having mobilized nearly $1 billion in giving through their storytelling-focused approach.
Their method was deceptively simple: start with a person, not a percentage.
When charity: water served a community in Nepal, they didn’t just report that diarrhea cases dropped from 6,433 in 2012 to 182 in 2016—they introduced donors to the families whose children no longer got sick, whose mothers no longer watched helplessly as their babies suffered.
In Cambodia, they shared the story of Kuen Leap, a woman who took out a loan for $1,000 to line her backyard well—more than twice her annual income of $480—because clean water was that important to her family. The story illustrated both the desperate need and the incredible value people place on the solution. The statistics about poverty and water scarcity became meaningful because donors could see them through Kuen’s eyes.
The Transformation
Armed with new understanding, Sarah completely reimagined her organization’s next impact report. She kept the statistics—donors do want proof their money is being used effectively—but she restructured everything around stories.
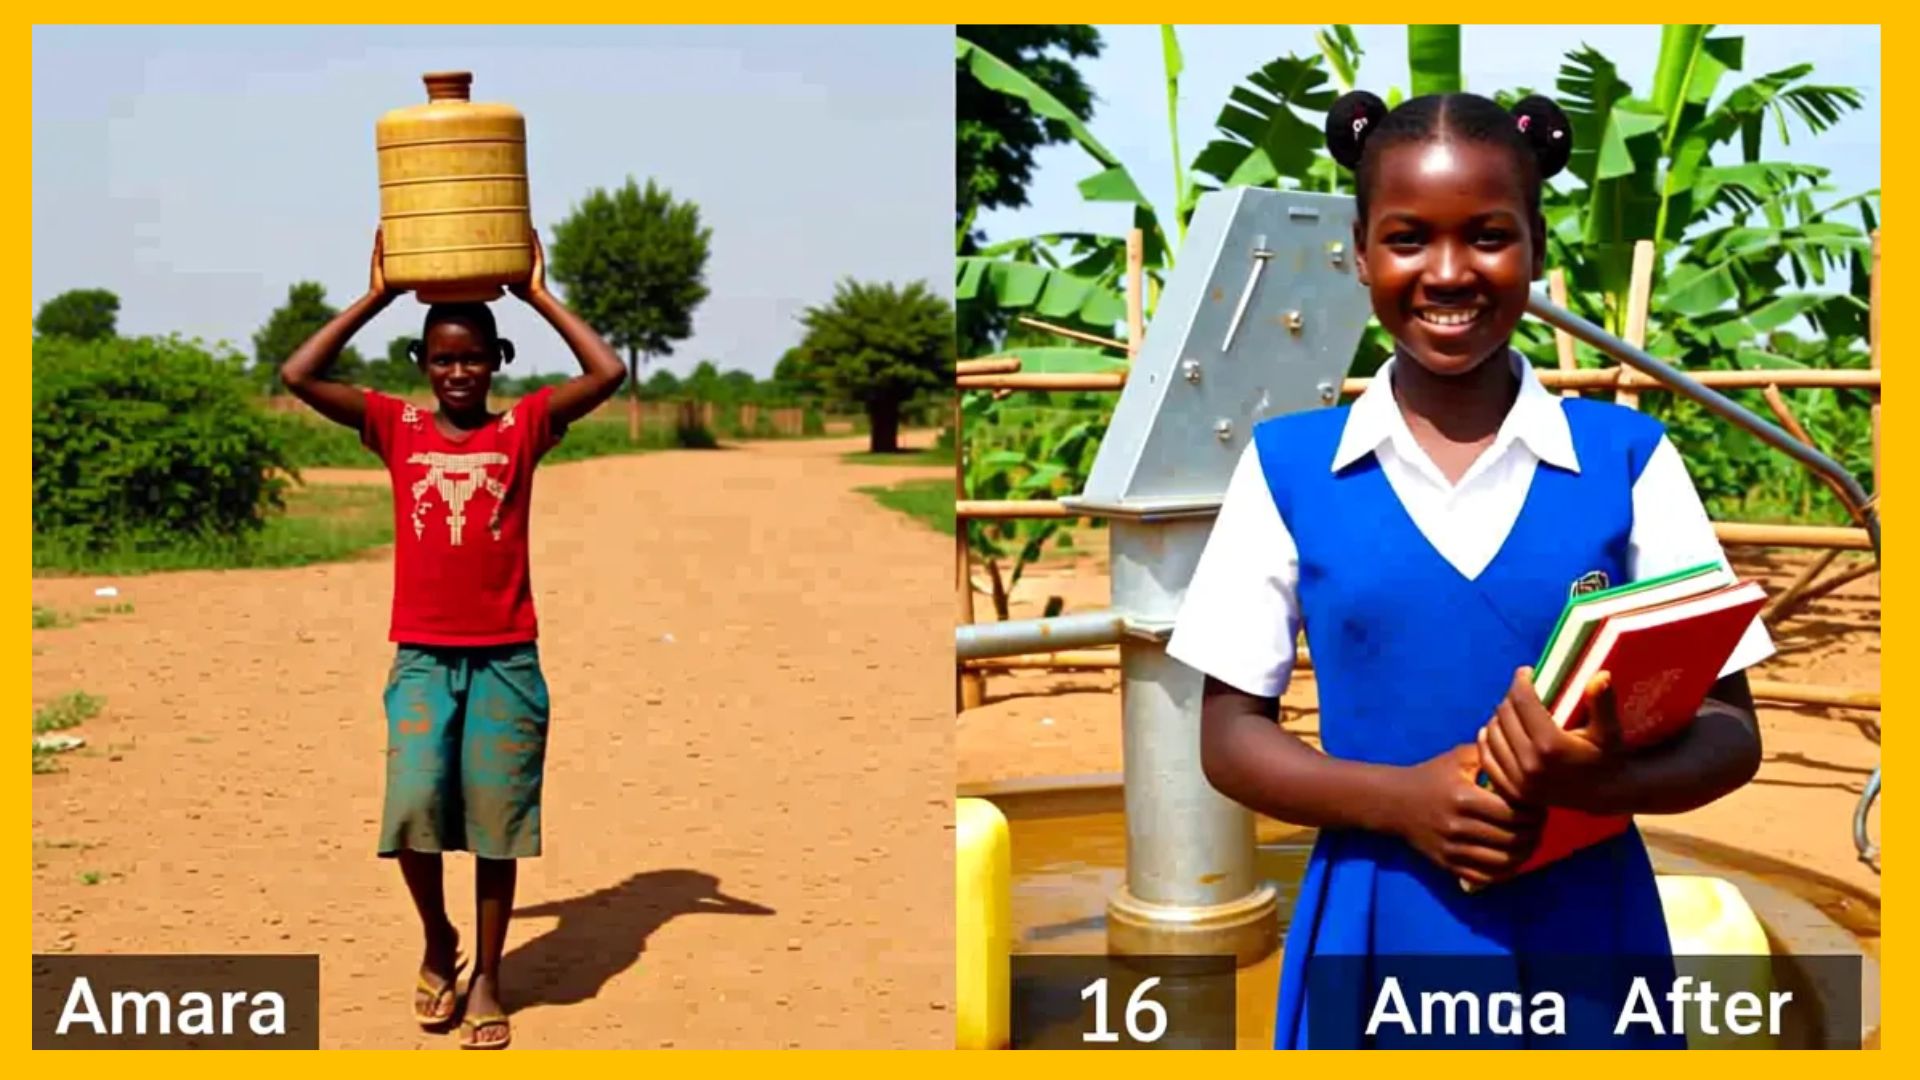
The report opened with Amara’s story—the girl whose journey had inspired Lisa’s first donation five years earlier. Readers learned that Amara was now 16, had completed secondary school, and was training to be a nurse. Her morning now started with studying, not a six-mile walk for water. The new well in her village meant she and 2,400 others now had safe water within a five-minute walk.
Only after readers met Amara did Sarah introduce the larger statistics—but now those numbers had a face. The 47,000 people served weren’t an abstract figure; they were 47,000 people like Amara, each with their own dreams now within reach.
Sarah included four more stories throughout the report: a father who could finally send his daughters to school, a shopkeeper whose business thrived when customers could trust the water, a grandmother who no longer feared her grandchildren would die from drinking contaminated water, a local mechanic trained to maintain the wells who could now support his family.
Between the stories, Sarah wove in the data—infection rates declining, school attendance increasing, economic activity growing. But the statistics now served the stories instead of replacing them.
The Results Speak
The response was immediate and overwhelming.
Within two months of releasing the story-driven report, donor retention climbed back up by 24%. Organizations that regularly review and adjust their storytelling approaches see retention improvements of approximately 34%, and Sarah’s organization was tracking toward that benchmark.
More importantly, donors were engaging differently. They forwarded the report to friends. They shared Amara’s story on social media. They asked questions about specific people instead of programs. And Lisa Chen? She not only renewed her donation but increased it to $750.
“I finally remembered why I started giving,” Lisa told Sarah. “I could see Amara. I could imagine my own daughter in her shoes. The statistics matter, but the story is what makes me feel connected to the work.”
Your Next Steps
If your impact reports look like the one Sarah used to create—data-heavy, statistics-forward, and story-light—you’re likely experiencing similar donor retention challenges.
The fix isn’t to eliminate data. The most effective fundraising combines stories with relevant statistics, as this pairing enhances credibility and builds trust. But the approach matters enormously.
Start with these three changes:
Lead with a person, not a program. Before you share any statistics, introduce one individual whose life changed because of donor support. Give them a name, show their face, let them speak in their own words about what the transformation meant to them.
Let the data support the story, not replace it. After you’ve connected donors emotionally to one person’s journey, then show them how that change is happening at scale. The statistics become powerful when they represent real people donors have already met.
Make it visual and authentic. Images and videos convey emotions more powerfully than words alone, and incorporating visual elements helps donors connect with the individuals behind the statistics. But authenticity is critical—share stories as they actually happened, avoid excessive image editing, and ensure statistics are grounded in reality.
The Deeper Truth
Here’s what Sarah learned through this transformation: donors don’t give to organizations. They give to people, through organizations.
Your impact report isn’t really about your programs, your wells, your schools, or your clinics. It’s about the humans whose lives change because those things exist. When donors can see themselves in your beneficiaries’ stories—when they can imagine their own child walking six miles for water, or their own parent suffering from preventable illness—that’s when statistics transform from abstract numbers into urgent calls to action.
When supporters understand that their contributions lead to real outcomes, they’re more likely to remain engaged and give again when asked. But understanding doesn’t come from spreadsheets and bar charts alone. It comes from connection, from empathy, from seeing one person’s life transform and extrapolating that to thousands.
Your next impact report is an opportunity—not just to inform donors about what you accomplished, but to remind them why they fell in love with your mission in the first place. Don’t let it be another 32-page document that donors dutifully skim and quickly forget.
Make it the story that keeps them coming back for years.
Because somewhere in your donor database is another Lisa Chen, wondering if her contribution still matters. And somewhere in the communities you serve is another Amara, whose story could inspire the next five years of faithful giving.
Your impact report’s job is to introduce them to each other—and let the transformation speak for itself.